
Photo via Bureau of Labor Statistics, LSEG.
***
Following the 43-day government shutdown and 6-week delay in releasing a key economic report, the U.S. government added 119,000 nonfarm jobs in September. However, with 470,000 people entering the labor force, the unemployment rate climbed to 4.4%.
Once again, the U.S. labor market is addressing one of economists’ favorite mixed signals: payroll reports deliver solid job gains, an uptick in the number of jobs added to the market, but the unemployment rate remains stubbornly elevated relative to pre-pandemic norms. As a Reuters article observes, “In 2022, the Bureau of Labor Statistics estimated there were more than two open jobs for each unemployed person. The number before the pandemic never went much beyond 1.24”. If firms are hiring, why aren’t the unemployed finding work at the same rate? To answer this, economists turn to the Beveridge curve, a tool that explains the relationship between unemployment and the number of open jobs.
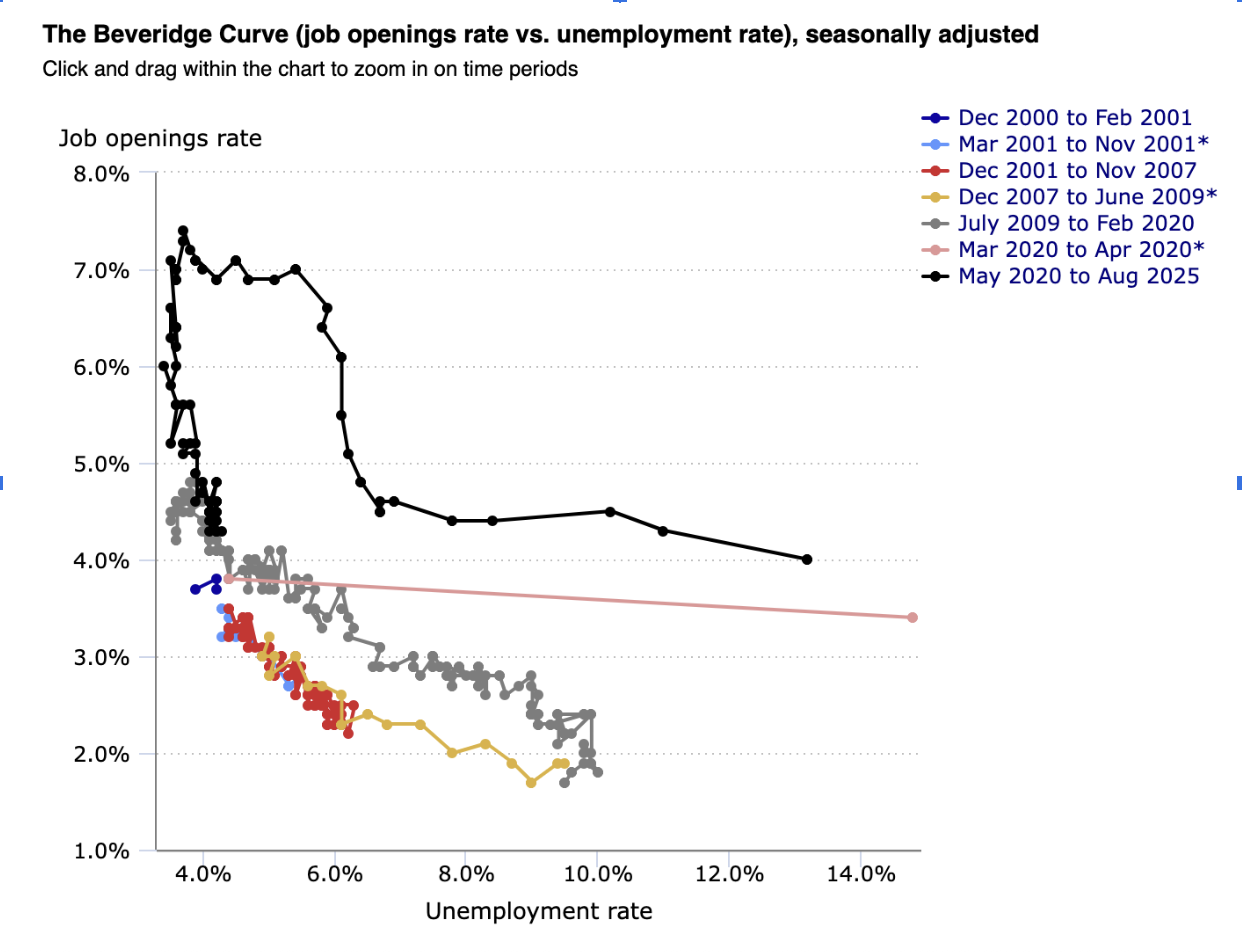
Image Via U.S. Bureau of Labor Statistics
***
Traditionally, the Beveridge curve slopes downward: when employment is high, vacancies tend to remain low. Conversely, as unemployment falls, job openings rise as firms compete for available workers. In a steady state, the flows into unemployment must equal the flows out of unemployment; on the onset of recessions, vacancies typically decline. This is standard in textbook labor economics and reflects a basic equilibrium principle in search-and-matching models.
In a departure from conventional patterns, the Beveridge curve began to shift outwards. The pandemic initially blew the curve open when unemployment rose. But by 2021-2022, unemployment had returned mainly to pre-pandemic levels, while job openings had skyrocketed. That should make job hunting feel like a breeze. In practice, it did not.
Filling a job now required more vacancies per hire, meaning workers were navigating a labor market full of “opportunities” that were harder to land. When the curve migrates outward, it indicates that job-matching has become increasingly “sticky”—a term used to describe how slow a variable is to adjust to market conditions.
In other words, the labor market is mismatched.
Why the curve shifted
There are two determinants to consider:
First, the sectoral mismatch is significantly higher than previously expected. For context, industries that once shed the most jobs in 2020—such as hospitality and childcare—were unable to recover to their previous status quo. Naturally, workers who left these sectors sought new occupations, and employers scrambled to rebuild workforces that no longer existed in the same capacity. According to research from the Society for Human Resource Management (SHRM), today’s vacancies are disproportionately concentrated in skilled trades. This means a higher number of vacancies exist alongside a pool of unemployed workers who lack the credentials for the aforementioned positions. This would explain an outward mismatch between the skills demanded and those available in the labor market.
Second, geographic mismatch also rose. Migration slowed down during the pandemic, housing costs exploded in major metropolitan areas, and even remote work altered commuting patterns. A Congressional Research Service report suggests that, post-pandemic, the share of job listings in “large central metro” areas dropped from ~46% before COVID to ~38% after, while listings in more peripheral regions increased. On the Beveridge curve, when jobs are located in areas where unemployed workers cannot afford to live or are unwilling to relocate, these jobs remain unfilled.
Labor-force shifts make the puzzle worse
If we assume that firms are hiring aggressively, the labor force they draw from is structurally different from the one that existed in 2019. For one, pandemic-induced early retirees have shrunk the available pool of workers. Intuitively, many firms post more openings to attract the smaller pool that remains, thereby increasing the probability of filling them.
But as we all know, not all job openings are created equal. Economists note that many firms now post “evergreen vacancies“—continuous listings intended to identify occasional hires rather than signal urgent labor demand. Other firms inflate vacancy numbers to test the market, build applicant pipelines, and even advertise positions to poach employed workers rather than filling positions from the unemployed.
These practices make the labor market appear tighter than it actually is. The curve’s deviation suggests that textbook search-and-match models—where unemployment and open jobs move toward equilibrium—are now taking much longer to complete.
Why this matters for interpreting the economy
Job gains look phenomenal in aggregate, yet for many unemployed workers, the market feels sluggish and employment feels strangely out of reach.
For policymakers, this matters deeply. Monetary policy can cool demand, but it cannot alchemize a laid-off hospitality worker into a licensed electrician overnight. Fiscal stimulus can expand hiring, but it cannot compel mobility in a market where rent inflation outpaces wage growth. Labor-force policies can stimulate participation, but they cannot reverse demographic realities such as early retirement or worker preference. If elevated unemployment reflects an overall structural mismatch rather than a straightforward barometer of economic health, then traditional methods of reviving the economy may not suffice.
The takeaway: Job gains are real, and unemployment is real. Moreover, the space between them—the Beveridge-curve shift—is where the future of market policy will be decided.
***
This article was edited by Chapin Fish.